|
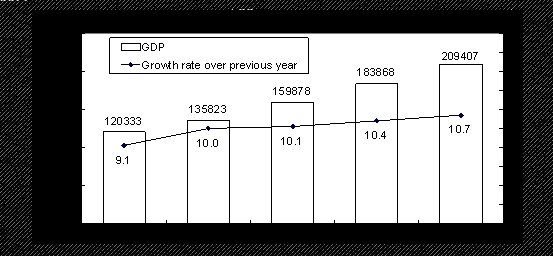
STATISTICAL COMMUNIQU OF THE PEOPLE'S REPUBLIC OF CHINA ON THE 2006 NATIONAL ECONOMIC AND SOCIAL DEVELOPMENT National Bureau of Statistics of China February 28, 2007 In 2006, under the leadership of the CPC Central Committee and the State Council, the people of all nationalities of China, taking as the guidance of Deng Xiaoping Theory and the important thought of Three Represents , adhered to the scientific approach to the economic and social development, endeavored to build a socialist harmonious society, carefully carried out various measures set by the central government aiming at enhancing and improving macro-control and made remarkable achievements in the national economic and social development. The major problems existing in the economic and social development are the extensive mode of economic growth and outstanding relationship within the economic structure. I. General OutlookIn 2006, the gross domestic product (GDP) of the year was 20,940.7 billion yuan, up by 10.7 percent over the previous year. The value added of the primary industry was 2,470.0 billion yuan, up by 5.0 percent. The value added of the secondary industry was 10,200.4 billion yuan, up by 12.5 percent. The value added of the tertiary industry was 8,270.3 billion yuan, up by 10.3 percent. The value added of the primary industry, secondary industry and the tertiary industry contributed 11.8 percent, 48.7 percent and 39.5 percent respectively to the GDP. Figure 1: Gross Domestic Product and Its Growth, 2002-2006
The general level of consumer prices in China was up by 1.5 percent over the previous year. Of this total, the prices for service items were up by 1.8 percent. The retail prices of commodities were up by 1.0 percent while the producer prices for manufactured goods increased by 3.0 percent and the purchasing prices for raw materials, fuels and power went up by 6.0 percent. The prices for investment in fixed assets were up by 1.5 percent. The producer prices of farm products were up by 1.2 percent. The sales prices for housing in 70 large and medium-sized cities were up by 5.5 percent. Table 1: Change in Consumer Prices in 2006 over 2005
Unit: %
Item
National
Average
Urban
Rural
General level of consumer prices
1.5
1.5
1.5
Food
2.3
2.5
2.1
Grain
2.7
2.7
2.9
Tobaccos and alcohols
0.6
0.8
0.3
Clothing
-0.6
-0.6
-0.4
Household appliances and services
1.2
1.3
1.0
Medical, health and personal articles
1.1
0.9
1.5
Transportation and telecommunications
-0.1
-0.7
1.3
Recreational, educational, cultural articles and services
-0.5
0.0
-1.4
Housing
4.6
4.7
4.6
At the end of 2006, the total of employed people in China numbered 764.00 million, or 5.75 million more than at the end of 2005. Of this total, 283.10 million were employed in urban areas, an increase of 11.84 million or a net increase of 9.79 million. The urban unemployment rate through unemployment registration was 4.1 percent at the end of 2006, a drop of 0.1 percentage point over that of 2005. At the end of 2006, China s foreign exchange reserves reached 1,066.3 billion US dollars, an increase of 247.5 billion US dollars as compared with that at the end of the pervious year. At the end of the year, the exchange rate was 7.8087 RMB to 1 USD, an appreciation by 3.35 percent over that at the end of 2005. The various taxes collected in the whole year reached 3,763.6 billion yuan (excluding tariffs, farm land taxes and deed taxes), up by 21.9 percent or an increase of 677.0 billion yuan over 2005. II. AgricultureIn 2006, the sown area of grain was 105.38 million hectares, an increase of 1.10 million hectares as compared with that in the previous year; the sown area of cotton was 5.40 million hectares, an increase of 340 thousand hectares; the sown area of oil-bearing crops was 13.80 million hectares, a decline of 520 thousand hectares; the sown area of sugar crops was 1.78 million hectares, an increase of 220 thousand hectares; and that for vegetables stood at 18.18 million hectares, an increase of 460 thousand hectares. The total output of grain in 2006 was 497.46 million tons, up by 13.44 million tons or by 2.8 percent over the previous year; that of cotton was 6.73 million tons, a growth of 17.8 percent; that of oil-bearing crops was 30.62 million tons, down by 0.5 percent and that of sugar crops was 109.87 million tons, an increase of 16.2 percent. Table 2: Output of Major Farm Products and the Growth Rates in 2006 Unit: 10,000 tons
| ||||||||||||||||||||||||||||||||||||||||||||||||||||||||||||||||||||||||||||||
Related News
Photos
More>>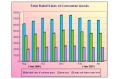
trade
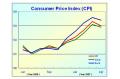
- Consumer Price Index (CPI) Kept Expanding in July
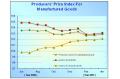
- Producers' Price Index (PPI) for Manufactured Goods Increased in July
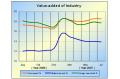
- Value-Added of Industry Expanded in the First Half Year
- Producers' Price Index (PPI) for Manufactured Goods Increased in June
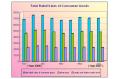
- Total Retail Sales of Consumer Goods Shot up in the First Half Year
market
- Consumer Price Index (CPI) Went up in June
- Total Investment in Fixed Assets Went up in the First Three Quarters
- National Real Estate Climate Index Expanded in September
- The Producer's Price of Agricultural Products Kept Rising in the First Three
- Value-added of Industry Grew up From January to September
finance
- Consumer Price Index (CPI) Kept Growth in September
- Total Retail Sales of Consumer Goods Shot up from January to September
- Producers' Price Index (PPI) for Manufactured Goods Kept Jumping in September
- National Real Estate Climate Index Expanded in November
- Value-added of Industry Kept Surging in November