One of the enduring features of the market is the prevalence of common thinking that is not supported by the facts. And yet the facts are easily located and available to all. The market fall in 2007 caught many by surprise but the head and shoulder reversal pattern was clear on the chart of the DOW and other global indexes.
 The rise and fall of the US dollar is said to be responsible for many movements in stock and commodity markets. When it looks like the US dollar is getting strong then many people believe this will deliver a blow to commodities and stock markets. On one level this makes intuitive sense, but when the history of price activity is investigated, the relationship is not as strong or consistent as many people believe. This can make the difference between success and failure in the market. Closer analysis of the market relationships allows for better decision-making and identifies better investment opportunities.
The common conclusion is that a strong US dollar leads to weaker commodity prices. We use copper as an example of a commodity. The monthly chart showing the combined behavior of the US Dollar Index and the copper price reveals some interesting relationships. In the period from 2005 through to the end of 2006 the US dollar was on a steady and strong upward trend, rising 11 percent. The copper price increased by 130 percent. A rising dollar was associated with a rising commodity price. It is not quite the result we expect.
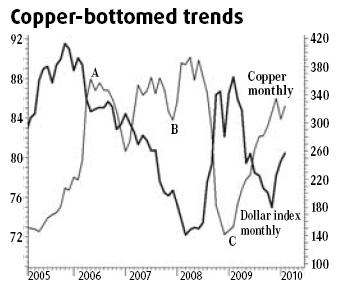
In early 2006 the US dollar fell by 3 percent and the copper price declined by 27 percent. Again, not quite the relationship we anticipate.
Starting in 2007 through to early 2008 the dollar fell by 21 percent. The copper price rose by 50 percent and this seems to confirm the relationships between the dollar value and commodity prices. This conclusion ignores the period towards the end of 2007 when copper fell by 16 percent and the dollar fell by 2.6 percent.
The year 2008 saw a 22 percent rise in the dollar index and a 64 percent fall in copper, confirming the commonly expected relationship. The late 2008 2 percent fall in the dollar was accompanied by a 19 percent fall in the copper price. In early 2009 the dollar rose by 15 percent after a sharp retreat in late 2008. Copper rose by 106 percent in the same period. In late 2009 the US dollar Index recovered from 75 cents with an 8 percent rise and the copper price upward momentum slowed to rise by 5 percent.
This brief history delivers several messages. The most important is that the relationship between the US dollar and individual commodities is variable. At times a strong dollar leads to weak commodity prices or vice versa. But for significant periods an inverse relationship prevails with a strong dollar co-existing with strong commodity prices. The reverse applies with a falling dollar co-existing with weakness in commodity prices. We cannot assume the value of the US dollar is the primary driver in the relationship. Other factors must be considered.
The next observation relates to the volatility of the US dollar. It is not always strong. The weakness in the US dollar in 2009 when it fell by 15 percent is not an unusual circumstance. Between 2006 and 2008 the US dollar fell by a much larger 21 percent. US dollar behavior is not a function of commodity pricing and commodity pricing is not primarily a function of US dollar behavior.
The third observation is more important for commodity pricing analysis in 2010 and beyond. The US dollar index is showing increased volatility up and down. The US dollar index has an initial target near 82 cents and the potential to retest 87 cents. On the downside the retreat has good support near 75 cents.
This is increased volatility in terms of the degree of change and the rate of change. It is also increased volatility in the frequency of change. Trends are more rapid and continue for shorter periods. In 2006 it took more than two years for the dollar to fall by 21 percent. In 2008 the dollar took less than a year to rise 21 percent. In 2009 it took less than 10 months to fall 15 percent. This suggests investors need to prepare for an increase in currency turbulence in 2010 with rapid rises and falls. Commodity traders will need to apply active hedging strategies to manage commodity pricing.
Currently the currency market behavior has more to do with interest rate differentials and perceptions of sovereign risk than with economic status.
The conclusion comes in three parts. First, the objective facts of price activity are available to everybody. Secondly, uncommon results in the market do not come from accepting common thinking. Thirdly, success comes from what you do with the information that is available to everybody. Better analysis leads to better results.
The author is CEO of Guppytraders.com, Darwin, Singapore, Beijing.