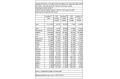
U.S. Clothing Import Quantity by Country (Jan.-Apr. 2007)
Date:Jun 15 2007
Rank
Country/Area
Quantity
(Thousand SQM)
(Ranked by Quantity)
Change%
Share%
World
7052853
9.11
100
_NAFTA
448924
-16.92
6.37
_CBI
1129222
3.91
16.01
1
China
2086989
51.78
29.59
2
Bangladesh
453840
10.62
6.43
3
Mexico
404996
-15.85
5.74
4
Indonesia
373401
14.74
5.29
5
Vietnam
357876
24.38
5.07
6
Honduras
350880
7.05
4.98
7
India
333997
4.15
4.74
8
Cambodia
275584
5.02
3.91
9
El Salvador
238511
27.93
3.38
10
Pakistan
208998
6.25
2.96
11
Thailand
171897
-7.64
2.44
12
Sri Lanka (Ceylon)
155793
0.91
2.21
13
Philippines
154683
-18.84
2.19
14
Dominican Republic
136687
-27.68
1.94
15
Guatemala
132869
-8.58
1.88
Source: U.S. Department of Commerce
Copyright © China Chamber of Commerce for Import & Export of Textiles Published By Garments Department
Copyright © China Chamber of Commerce for Import & Export of Textiles Published By Garments Department