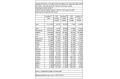
U.S. Textiles & Clothing Import Value by Country (Jan.-Apr. 2007)
Date:Jun 15 2007
Rank
Country/Area
Value
(Thousand Dollars)
(Ranked by Value)
Change%
Share%
World
29430272
7.22
100
_NAFTA
2551014
-12.43
8.67
_CBI
2658649
0.22
9.03
1
China
8934519
39.92
30.36
2
India
1862434
-1.48
6.33
3
Mexico
1768611
-11.46
6.01
4
Indonesia
1443530
19.33
4.90
5
Vietnam
1244041
19.70
4.23
6
Bangladesh
1069519
16.96
3.63
7
Pakistan
948708
-3.59
3.22
8
Canada
782403
-14.54
2.66
9
Cambodia
781012
21.09
2.65
10
Honduras
748228
5.85
2.54
11
Thailand
666754
-5.46
2.27
12
Italy
654269
10.44
2.22
13
Philippines
600975
-9.47
2.04
14
Sri Lanka (Ceylon)
575182
-0.72
1.95
15
Hong Kong
514932
-45.43
1.75
Source: U.S. Department of Commerce
Copyright © China Chamber of Commerce for Import & Export of Textiles Published By Garments Department
Copyright © China Chamber of Commerce for Import & Export of Textiles Published By Garments Department