Markets have retreated recently. The DOW is testing the 10,000 area and the Shanghai Index is testing the 3,000 area. Markets are a measure of economic strength but they also reflect the behavior of investors who are prone to overreactions. Commodity markets can provide another perspective on economic strength and development.

Copper is used as a measure of the developing strength of an economy. It is a foundation industrial metal for many basic economic processes. The behavior of the sustained rise in the price of copper suggests a sustained rise in economic demand fuelled by a global recovery. The weekly chart shows the underlying trend.
The modern economy is more sophisticated than the foundation copper economy. A useful way to track the growth of the modern economy is by following the price and trend activity of precious metals such as platinum. This gives a platinum standard of economic measurement.
Platinum is the most valuable of precious metals because it is necessary for many industrial applications. About one-fifth of everything used in advanced economies either contains platinum or requires platinum in its manufacture. Most of the annual platinum production is used in catalytic converters in car exhaust systems and fine jewelry. These two applications consume more than 70 percent of the world's supply of platinum. The third most common use is in computer hard drives. Platinum-enhanced magnetic alloy allows data to be stored at much higher densities.

Platinum is essential for advancing economies. Economic recovery, shown by the copper price, is important. Continued modernization, shown by platinum takes economic recovery to the next level. Platinum is more sensitive to changes in the economy. When the economic times deteriorate, people buy fewer cars, they buy less expensive jewelry and cut back on computer purchases. The demand for platinum, reflected in the price, provides an early warning for the quality of the economic recovery.
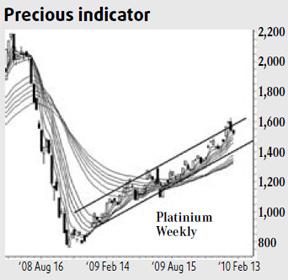
The weekly platinum chart shows a steadily rising trend that is defined by two features. The first is the development of a parallel trading channel. The second is the strength of investor support for the trend.
The rising trend channel is best seen on a weekly chart. The lower edge of the trading channel starts with the January 2009 breakout and is confirmed with price rebounds from the area in May 2009. The lower edge of the channel was broken in July 2009, but the following price activity confirmed the strength and stability of the channel support.
The upper resistance level of the channel line starts in February 2009 and it runs parallel to the lower support line. However, this resistance level is relatively weak. The breakouts in April and June suggest a more appropriate position for the upper trend line. The most important conclusion from this is that although support for the trend is strong, the weak channel resistance suggests the bullish bias in the trend is even stronger. This is an indication of the economic strength of modernization.
This bullishness is confirmed with a rapid break above the historical strong resistance level near 1,330. This caused barely a pause in the new rising trend. Weaker historical resistance near 1,450 also offered little resistance to the new uptrend. This area may be retested in the near future. The next significant historical resistance level is near 1,820 and this suggests an extended upside for platinum and for economic growth.
The strength of investor support for the trend is shown on the weekly chart, but it is more clearly seen on the daily chart using a Guppy Multiple Moving Average indicator.
The author is a well-known international financial technical analysis expert and is known as "The Chart Man".


