|
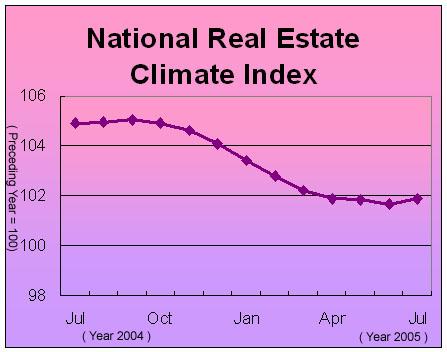
In July, the real estate climate index was 101.86, increased by 0.21 percentage points as compared with that in June, the year-on-year change was down by 1.13 percentage points. The land development space index was 95.87, rose by 0.80 percentage points as compared with that in June, and 2.06 percentage points lower as compared with that in the same month of last year. From January to July, the accumulative construction space was 96.63million square meters, up by 1.0 percent. The real estate development investment index was 101.60, up by 0.49 percentage points as compared with that in June, and 1.13 points lower than that of last July. From January to July, the complete real estate development investment was 758.7 billion yuan, an increased of 23.5 percent as compared with that in the same period of the previous year. Of which, the commercial dwelling investment was 508.9 billion yuan, increased by 22.2 percent. The economically suitable dwelling investment was 26.0 billion yuan, a decreased of 12.1 percent. The housing construction space index was 103.65, up by 0.48 percentage points over June, and down by 3.99 percentage points over last July. From January to July, the total completed housing construction space was 1.245 billion square meters, an increase of 19.9 percent. Of this total, Office construction space was 0.052 billion square meters, increased by 13.1 percent; commercial operation construction space was 0.158 billion square meters, an increased of 20.1 percent. The capital source index was 101.27, a rise of 0.47 points over that in June, and a decrease of 3.37 points as compared with that in the same month of the previous year. From January to July, the capital source of real estate development enterprises was 1114.1 billion yuan, rose by 23.5 percent. Of which, the domestic loans was 207.8 billion yuan, rose by 7.9 percent; that of self-raised funds was 382.0 billion yuan, rose by 37.7 percent; that of foreign investment utilization was 14.2 billion yuan, rose by 16.3 percent. The commercial housing vacant space index was 103.28, 0.28 points lower than that in June, and 5.66 points lower than that in last July. At the end of July, the total vacant space was 0.106 billion square meters, increased by 8.9 percent. Of which, commercial housing vacant area to 0.060 billion square meters, an increase of 3.1 percent. The sales price index of commercial house was 104.21, decreased by 0.28 points as compared with that in June, and 1.96 points higher than that in the same month of last year. From January to July, the average selling price of commercial housing rose by 9.7 percent. Of which, the average selling price of residential building was up by 11.0 percent; that of office buildings up by 0.9, and that of business buildings and houses rose by 8.9 percent. |
Related News
Photos
More>>trade
- The Real Estate Climate Index Remain the General Level in August
- The producers' Price Index (PPI) for Manufactured Goods Increased 4.5 Percent in
- The Consumer Price Index (CPI) Increased in September
- The Total Retail Sale of Consumer Goods Increased in September
- The Value-added of Industry Rose by 16.3 Percent in September
market
- The Urban Investment in Fixed Assets Continued Increasing in September
- The Total Retail Sale of Consumer Goods Increased in November
- The Value-added of Industry Up by 16.6 Percent in November
- The Consumer Price Index (CPI) Increased in November
- The Producers' Price Index (PPI) For Manufactured Goods Increased 3.2 Percent in
finance
- The Real Estate Climate Index Kept Declining in October
- The Urban Investment in Fixed Assets Continued Increasing from January to
- The Value-added of Industry Up by 16.1 Percent in October
- The Total Retail Sale of Consumer Goods Increased in October
- The Consumer Price Index (CPI) Increased in October


