|
In 2004, the Chinese government kept on giving key priorities to the issue of rural poverty. A series of preferential policies and measures have been laid out and put in practice by enlarging fiscal inputs to rural area, largely lightening tax burden of rural households especially those living in poor areas, fastening the construction of the rural social security system. Those lower-income rural households and other vulnerable groups who depended mainly on agriculture were widely benefited. Through corporate efforts of the whole society, new progress of poverty alleviation has been made in China in 2004. 1. General outlook of economic and social development of rural area 1.1 Agriculture In 2004, the value-added of primary industry reached 2074.4 billion yuan, up by 6.3 percent over the previous year. The total output of grain was 469.47 million tons, up by 38.77 million tons or 9.0 percent. The output of cotton was 6.32 million tons, an increase of 30.1 percent; that of oil-bearing crops was 30.57 million tons, up by 8.8 percent. The output of sugar crops was 95.28 million tons, a decrease of 1.2 percent. Steady progress was seen in vegetable and fruits production due to expanded use of high quality varieties. The total output of meat for the year reached 72.60 million tons, up by 4.7 percent. The total output of aquatic products was 48.55 million tons, up by 3.2 percent. 1.2 Income of rural households In 2004, the per capita annual net income of rural households was 2936 yuan, up by 314 yuan or 12 percent in nominal terms over the previous year. It registered the highest growth since 1997 with a real increase of 6.8 percent after price factors were deducted. As a result of a series of supportive and preferential agricultural policies, along with the pick-up of grain price in the market and favorable climate for agricultural production in 2004, rural households got much more income from agriculture, which was the record high since the reform and opening policy was adopted by reaching 176 yuan per capita, up by 20 percent. The income of the poor and low-income households depending mainly on agriculture increased markedly. By income quintile, the nominal income growth of the bottom 20% households was 16.3 percent, 4.3 percentages higher than the national average, 7.1 percentages higher than that of the top 20% households. 1.2 Life of rural households In 2004, the per capita living expenditure of rural households was 2185 yuan, up by 241 yuan or 12.4 percent in nominal terms. After deducting price factors, the real increase was 7.3 percent which was the highest growth since 1997. The expenditure on food, clothes, housing, facilities, education, health, transportation and communications increased comprehensively. Both quantity and quality of assets and living facilities owned by rural households was improved significantly (table 1). Table 1: Assets and living facilities of rural households in China, 2004 and 2003
Indicator
2004
2003
Per capita floor space of living houses (square meter)
27.9
27.2
Proportion of rural households living in houses of reinforced concrete structure or brick and wood structure (%)
26.6
25.2
Proportion of rural households whose houses were linked with hard surfacing road (%)
49.6
Proportion of rural households with toilet %
89.9
89.5
Proportion of rural households with heating system %
41.5
40.1
Proportion of rural households using liquefied petroleum gas or electricity fuel %
10.6
8.9
Proportion of rural households using tap water %
34.6
32.6
Number of color TV owned per 100 households
75.1
67.8
Number of telephone owned per 100 households
89.2
72.8
Number of washing machine owned per 100 households
37.3
34.3
Number of refrigerate owned per 100 households
17.8
15.9
Number of motor cycle owned per 100 households
36.2
31.8
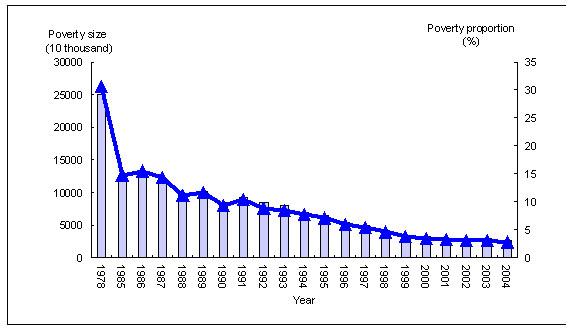
1.4 Income distribution In 2004, the Gini coefficient within rural households was 0.3692, up by 0.0012 over the previous year, which was lower than the increment of 0.0034 in 2003. The income ratio of urban to rural households basically maintained last year s level of 3.2:1. 1.5 Social securities of rural area In 2004, a total of 333 counties/cities conducted experiments on new medical care cooperation system in rural area, covering approximately 106.91 million of rural population and attracting 80.4 million farmers to the new system. Experiments ofthe rural minimum income security system (DiBao system) were also made in some areas. 2. National poverty status 2.1 Poverty line According to rural CPI, the government poverty line was adjusted from 637 yuan in 2003 to 668 yuan in 2004, low-income line from 882 yuan to 924 yuan. 2.2 Poverty size By the end of 2004, the rural population in absolute poverty was 26.1 million, a decline of 2.9 million from the previous year and took up 2.8 percent of the total rural population, down by 0.3 percentage points. The low-income population that the food and clothing problems were preliminarily solved in rural area was 49.77 million, a decline of 6.4 million. The proportion of the low-income population to the total rural population was 5.3 percent, down by 0.7 percentage. Figure 1: Size and proportion of absolute poverty population inChina, 1978-2004
Table 2: Poverty line, size and proportion of China, 2000-2004
Year
Absolute Poverty
Low-income
Poverty Line
(yuan)
Size
(million)
Proportion
(%)
Low-income line
(yuan)
Size
(million)
Proportion
(%)
2000
625
32.09
3.5
865
62.13
6.7
2001
630
29.27
3.2
872
61.02
6.6
2002
627
28.20
3.0
869
58.25
6.2
2003
637
29.00
3.1
882
56.17
6.0
2004
668
26.10
2.8
924
4977
5.3 | |||||||||||||||||||||||||||||||||||||||||||||||||||||||||||||||||||||||||||||||||||||||
Related News
Photos
More>>
trade
- The Total Retail Sale of Consumer Goods Increased by 12.7 Percent in July
- The CPI Increased by 1.8 Percent in July
- The producers' Price Index (PPI) for Manufactured Goods Up by 5.2 Percent in
- The Real Estate Climate Index Decreased in June
- The Total Retail Sales of Consumer Goods Up by 13.2 Percent in the First Half of
market
- The Consumer Price Index (CPI) Increased in August
- The Total Retail Sale of Consumer Goods Increased in August
- The Value-added of Industry up by 16 Percent in August
- The Real Estate Climate Index Remain the General Level in August
- The producers' Price Index (PPI) for Manufactured Goods Increased 4.5 Percent in
finance
- The Consumer Price Index (CPI) Increased in September
- The Total Retail Sale of Consumer Goods Increased in September
- The Value-added of Industry Rose by 16.3 Percent in September
- The Urban Investment in Fixed Assets Continued Increasing in September
- The Total Retail Sale of Consumer Goods Increased in November