Indeed, Chinese cotton spinning industry was still posting bullish growth during the first three quarters of 2010, though a number of uncertainties linger on. Since 2010, cotton prices have been increasing at an unprecedented level in China. Cotton spinning mills faced a challenging environment in high purchasing prices where they have to pass higher material costs on to higher yarn prices. Besides, yuan appreciation, Currency War and "Trade War" could may pull down the performance of the industry in Q4.
Output surged
China's cotton spinning industry saw a sharp increase in the output in the first eight months this year, according to data collected from statistics-worthy Chinese textile enterprises surveyed by National Bureau of Statistics of China. Looking further, from January to August, yarn output of the industry reached 17.499 million tons, up 16.23 per cent from the previous year's period; fabric 41.14 billion metres, up 17.43% year-on-year.
In Jan.-Aug., Shandong province ranked first in term of yarn output, followed by Jiangsu and Henan, whose output accounted for 58.5% of China s total; Zhejiang province ranked first in term of fabric output, followed by Shandong and Jiangsu, whose output accounted for 59.8% of China s total.
Trade surplus climbed
Cotton textile and apparel export was on its way to recovery, as it was rapidly returning to its pre-crisis highest level. According to China Customs, the exports value of Chinese cotton textile and garment amounted to $49.41 billion in the first eight months of 2010, up 23.48 per cent y/y. On the other hand, the imports value of cotton textile and garment amounted to $4.08 billion in the first eight months of 2010, registered a growth of 16 percent y/y. That said, China posted a $45.33 billion trade surplus for the period of Jan.-Aug., capping the largest excess since 2002.
Chart 2. China cotton textile and apparel export from January to August 2010
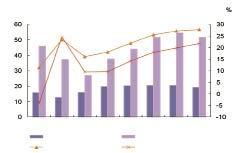
Jan.Feb.Mar.Apr.MayJun.Jul.Aug.
value, cotton textile value,cotton apparel
y/y change, cotton textiley/y change, cotton apparel
Looking further, the exports value of cotton yarn amounted to $1.57 billion in the first eight months of 2010, up 28.83 per cent y/y. The average unit value registered a growth of 17.68 percent y/y. Cotton prices have been increasing at an unprecedented level in China. Prices have been going up internationally as well. Cotton spinning mills faced a challenging environment in high purchasing prices where they have to pass high material costs on to higher yarn prices.
The exports value of cotton fabric amounted to $6.52 billion in the first eight months of 2010, up 40.71 per cent y/y. The average unit value registered a growth of 10.26 percent y/y. Of which 100% cotton fabric exports accounted for 86.7% of total cotton fabric exports.
In Jan.-Aug., China accumulated raw cotton imports amounted to 19.52 million tons, up nearly 100 per cent y/y. China's raw cotton imports reached 240,000 tons in Aug. and 200,000 tons in Sep.
In Jan.-Aug., China accumulated cotton yarn and thread imports amounted to 733,000 tons, up 12.49 per cent y/y.
In Jan.-Aug., China accumulated cotton fabric imports amounted to 550 billion metres, down 6.14 per cent y/y. Of which, 100% cotton fabric imports had been registering a negative growth of 8.8% while cotton blended fabric imports had been registering a positive growth of 11.34%.
New trade structure
For exports, China Hongkong and ASEAN have been the Mainland's number one cotton textile and apparel export destination. Export to ASEAN was leading the 1st , with a growth rate of 41.88%. The trade rise was due to their stimulus packages which raised their global purchasing power as well as and China's Free Trade Agreement with ASEAN.The China-ASEAN Free Trade Area, the world's largest free trade area of developing countries, covers a population of 1.9 billion and accounts for about 4.5 trillion U.S. dollars in trade volume. China-ASEAN free trade agreement resulted in huge growth in bilateral trade between China and ASEAN, especially since the demand from the United States and Europe has plummeted during the global financial crisis.
For imports, China's cotton textile and apparel imports from Hongkong, ASEAN, the United States, the EU and Japan accounted only 27.9% of China s total, which shows China has created the new multiple-source environment.
Related News
Photos
More>>


trade
- FDF: Resolve legal limbo on 'no added salt' claims
- Change4Life didn't change anything, claims academic
- Vice Minister Zhang Taolin Focuses on Innovation of Management Mechanism and
- Minister Han Changfu Meets with Italian Minister of Agriculture, Food and
- Vice Minister Zhang Taolin: Promote the Development of Seed Industry