According to National Bureau of Statistics of China, from January to May 2010, total profits of China s Chemical FibreIndustryjumped 200 per cent to 8.066 billion yuan. The production rose 13.43 percent y/y to 14.4739 million tons in the first half of 2010. Goods delivered for chemical fiberexports increased by 50.21 per cent to 792,000from January to Mayfrom the year-earlier period.
Production and Sales Grew Steadily
Chinese chemical fiber production rose 13.43 percent y/y to 14.4739 million tons in the first half of 2010. Looking further, from January to June, polyester output reached 11.6041 million tons, up 13.31 per cent from the previous year's period; rayon 953,800 tons, up 13.29 y/y; and spandex up 40.56% y/y.
During Jan.-May period, enterprises in the chemical fiber sector saw their production-to-sales ratio edged down by 1.56% year on year to 96.82%. Looking further, the production-to-sales ratio of the rayon sector edged down 7.07%; acrylic down 6.27%; and polyester up 0.13%.
Exports recovery
Goods delivered for chemical fiberexports increased by 50.21 per cent to 792,000from January to Mayfrom the year-earlier period.
Meanwhile, chemical fiber production recovery with limited domestic supply led to the improvement of material imports. Imports for main chemical fiber materials increased by 11.62 per cent to 6.67 million in the past five months from the year-earlier period. Looking further, from January to May, ethylene glycol imports increased by 18.92 per cent to 2.85 million tons; PTA 2.72 million tons, up 4.93% y/y.
Profits surged
According to National Bureau of Statistics of China, from January to May 2010, total profits of the industry jumped 200 per cent to 8.066 billion yuan.
Table 1. Economic performance of China s chemical fibre industry in Jan.-May 2010
|
Total profits (CNY100 million) |
Lost value of loss-making enterprises (CNY100 million) |
|||||
|
Jan.-May 2010 |
the same period last year |
y/y change |
Jan.-May 2010 |
the same period last year |
y/y change |
|
|
Chemical fibre |
80.66 |
26.88 |
200.07% |
6.61 |
21.10 |
-68.67% |
|
Man-made fibre |
18.17 |
12.31 |
47.60% |
1.25 |
2.15 |
-41.78% |
|
Polyester |
36.45 |
12.71 |
186.78% |
4.03 |
9.08 |
-55.59% |
|
Acrylic |
0.37 |
-2.85 |
0.12 |
3.18 |
-96.25% |
|
|
Nylon |
7.41 |
0.40 |
1752.5% |
0.29 |
2.74 |
-89.59% |
|
Other Synthetic Yarns |
14.93 |
3.53 |
322.95% |
0.74 |
3.01 |
-75.46% |
Source: National Bureau of Statistics of China
From January to May, the total industrial production value of Chinese chemical fiber industry increased 37.79 percent y/y to CNY187.625 billion. The main business income increased 36.94 percent y/y to CNY182.474 billion.
From Jan. to Jun., China has made an investment of 14.838 billion yuan in chemical fiber industry, up by 29.25 percent over the same period last year. The industry registered new projects totaling 195, according to the Statistics Center of CNTAC.
Materials prices: downward trend
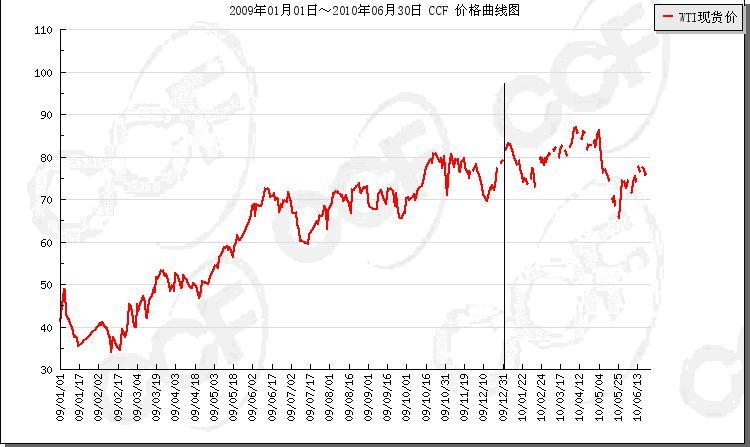
Materials:The first chart shows the average crude oil price from 2009 to the present. Prices of crude oil slumped down in Jan. 2010. The upward turned on during Feb.-Mar., followed recovery in consumer confidence. In May, prices of crude oil went down again as a result of the increase of the United States s stock and then went sharp again in Jun. amid a massive spill in the Gulf of Mexico. Crude oil traded in New York will average $85 a barrel in 2010, Morgan Stanley said, 31 percent higher than its previous estimate of $65 a barrel, as demand recovers and supplies decline. Oil demand is expected to rise 1.4 million barrels a day, or 1.7 percent, in 2010, led by emerging markets outside the Organization for Economic Cooperation and Development, the International Energy Agency said on July 10.
Chart 1. WTI in 2009-2010

The slump in crude oil values provided limited cost support to PTA markets in Jan.-Feb. Simultaneously, demand was also affected. PTA costs increased dramatically during March and went down since May as a result of the slump in crude oil values.
The price of EG slumped down since the beginning of 2010, followed the slump in crude oil values. And then it continued to cool down in Chinaas a result of the increase of Middle East s production. In Asian ethylene glycol market, the price what buyers inquiry cargo was around 790 U.S. dollars/ton in August/early September. In East China Market, the price was 6500-6550 yuan/ton. South China Market was stable due to the limited cash flow and few sellers offer. Price about part of the offer was 6600-6700 yuan/ton
Downstream: It is important to note that output of chemical fibre yarn, chemical fibre cloth, nonwovens cloth and tyre cordhave jumped by 28.66%, 12.15%, 19.28% and 18.12% respectively y/y.
Outlook for the 2nd half
For prices of materials, here we are quick to point out the fluctuate on high level;
For the output of chemical fibre, it is forecast at 29.80 million tons, up by 10%;
For the import of chemical fibre, it is forecast at 900,000 tons, up by 5%;
For the export of chemical fibre, it is forecast at 2 million tons, up by 35%;
For the total profit of the industry, it is forecast at 12-13.5 billion yuan.


