|
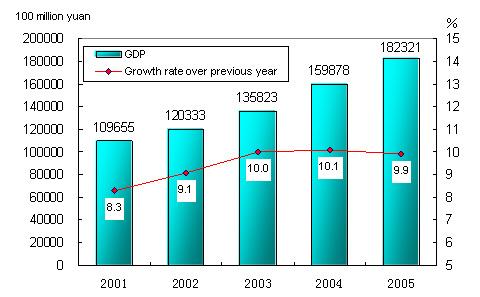
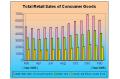
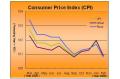
STATISTICAL COMMUNIQU OF THE PEOPLE'S REPUBLIC OF CHINA ON THE 2005 NATIONAL ECONOMIC AND SOCIAL DEVELOPMENT National Bureau of Statistics of China February 28, 2006 In 2005, under the correct leadership of the CPC Central Committee and the State Council, people of all nationalities of China, taking as the guidance of Deng Xiaoping Theory, the important thought of Three Represents , and the scientific approach to development for economic and social development, carefully carried out various measures set by the central government aiming at enhancing and improving macro-control. Remarkable achievements were made in national economic and social development. The national economy kept stable and fairly fast growth; breakthrough was made in reforms in major fields and key sectors; employment and social security programs were further enhanced; the living standard of urban and rural population improved; China was opening wider to the outside world; and various social undertakings were strengthened. Main targets set forth for the economic and social development at the beginning of the year had been achieved, and the major tasks of the 10th Five-year Plan had been fulfilled which had laid a solid foundation for the economic and social development for the 11th Five-year Program. However, the problems of irrational economic structure and extensive mode of economic growth are still prominent. I. General Outlook Preliminary estimation indicated that the gross domestic product (GDP) of the year was 18,232.1 billion yuan, up by 9.9 percent over the previous year. The value-added of the primary industry was 2,271.8 billion yuan, up by 5.2 percent. The value-added of the secondary industry was 8,620.8 billion yuan, up by 11.4 percent. The value-added of the tertiary industry was 7,339.5 billion yuan, up by 9.6 percent. The value-added of the primary industry, secondary industry and the tertiary industry accounted for 12.4 percent, 47.3 percent and 40.3 percent respectively of the GDP. Figure1: Gross Domestic Product and Its Growth in the 10th Five-year Plan Period The general level of consumer prices in China was up by 1.8 percent over the previous year (Table 1). Of this total, the prices for service items were up 3.3 percent. The retail prices of commodities were up by 0.8 percent, while the producers prices for manufactured goods increased by 4.9 percent, and the purchasing prices for raw materials, fuels and power went up by 8.3 percent. The prices for investment in fixed assets were up 1.6 percent. Producers prices of farm products were up by 1.4 percent. The sales prices for housing in 70 large and medium cities were up by 7.6 percent.
By the end of 2005, the total of employed people in China numbered 758.25 million, or 6.25 million more than at the end of 2004. Of this total, 273.31 million were employed in urban areas, an increase of 9.7 million or a net increase of 8.55 million. The urban unemployment rate through unemployment registration was 4.2 percent at the end of 2005, maintaining the same level as that in 2004. By the end of 2005, China s foreign exchange reserves reached 818.9 billion US dollars, an increase of 208.9 billion US dollars as compared with that at the end of the pervious year. On July 21st, 2005, reform was initiated in the mechanism of RMB exchange rate. By the end of the year, the exchange rate was 8.0702 RMB to 1 USD, an appreciation by 2.56 percent over that at the end of the previous year. Various tax incomes for the whole year reached 3,086.6 billion yuan (excluding tariffs and agricultural taxes); it was up by 20.0 percent or an increase of 514.8 billion yuan over 2004. The profits made by industrial enterprises above designated size stood at 1,436.2 billion yuan, up by 22.6 percent over the previous year, and the ratio of profits to sales was 5.9 percent, which was 0.1 percentage point lower than that in the previous year. II. Agriculture In 2005, the sown areas of grain was 104.27 million hectares, an increase of 2.67 million hectares as compared with that in the previous year, and the sown areas of cotton was 5.06 million hectares, a decline of 630,000 hectares. The sown areas of oil-bearing crops was 14.31 million hectares, a decline of 120,000 hectares, the sown areas of sugar crops was 1.56 million hectares, a decrease of 10,000 hectares; and that for vegetables stood at 17.74 million hectares, an increase of 180,000 hectares. The total output of grain in 2005 was 484.01 million tons, up by 14.54 million tons or 3.1 percent over the previous year. The output of cotton was 5.70 million tons, a decrease of 9.8 percent; that of oil-bearing crops was 30.78 million tons, up by 0.4 percent. The output of sugar crops was 95.51 million tons, a decrease of 0.2 percent. Steady progress was made in vegetable and fruit production with optimized varieties (Table 2).
| ||||||||||||||||||||||||||||||||||||||||||||||||||||||||||||||||||||||||||||||||||||||||||||||||||||