|
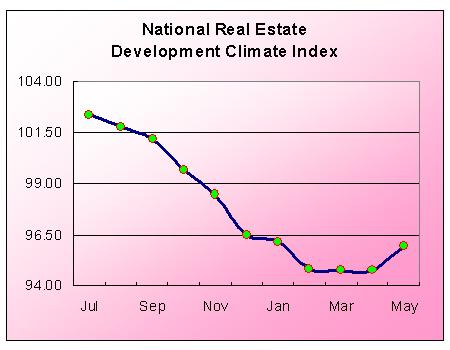
I. The completion of real estate development From January to May, the total investment in real estate development was 1,016.5 billion yuan, up by 6.8 percent year-on-year, and went up 1.9 percentage points over first four months, while that of a decrease of 25.1 percentage points over same period of previous year. Of which, investment in commercial residential buildings reached 710.5 billion yuan, 4.4 percent of increase year-on-year, picking up 1.0 percentage points over first four months, or 30.6 percentage points dropped over same period of previous year, which occupied 69.9 percent of the investment in real estate development. From January to May, the floor spaces under construction of real estate development enterprises in the whole country stood at 2185 million square meters, a year-on-year increase of 11.7 percent, dropped 0.7 percentage points over first four months; the new started floor spaces of housing stood at 357 million square meters, declined 16.2 percent year-on-year, and 0.6 percentage points promoted over first four months; the floor spaces completed reached 162 million square meters, climbing up 22.6 percent year-on-year, or 4.5 percentage points decreased over first four months. Of which, the floor spaces completed of residential buildings hit 133 million square meters, went up 23.6 percent, or decreased 4.9 percentage points over first four months. From January to May, the floor spaces purchased of real estate development enterprises in the whole country reached 98.75 million square meters, dropped 28.6 percent year-on-year; the floor spaces developed hit 88.45 million square meters, decreased 13.3 percent year-on-year. II. Sales of commercial buildings From January to May, the floor spaces of commercial buildings sold accounted for 246.44 million square meters, surging up 25.5 percent year-on-year. Of the total, the floor spaces of residential buildings sold increased 26.7 percent; that of office buildings dropped 1.8 percent; that of buildings for commercials uses went up 18.3 percent. From January to May, the total sales of commercial buildings amounted to 1,138.9 billion yuan, up by 45.3 percent year-on-year. Of which, the sales of commercial residential buildings surged 49.0 percent, that of office buildings and buildings for commercial uses increased 11.6 and 27.9 percent respectively. III. The funds sources of real estate development enterprises From January to May, the funds sources of real estate development enterprises reached 1,752.3 billion yuan, a year-on-year increase of 16.1 percent. Of the total, domestic loans amounted to 396.2 billion yuan, up by 15.8 percent; that of utilization of foreign funds reached 22.5 billion yuan, decreased 8.7 percent; that of self-financing funds hit 624.4 billion yuan, went up 10.9 percent; that of other funds accounted for 709.1 billion yuan, rose by 22.3 percent. In view of the other funds, deposits and advantage payments totaled 415.8 billion yuan, ballooned 17.2 percent; and that of personal mortgage loans stood at 198.3 billion yuan, gained in 39.8 percent. IV. Sales price indices of buildings in 70 medium-large sized cities In May, sales price indices of buildings in 70 medium-large sized cities decreased 0.6 percent year-on-year, narrowed 0.5 percentage points over April; the chain index was booming up by 0.6 percent, increased 0.2 percentage points over April. The sales price indices of newly constructed residential buildings dropped 1.3 percent year-on-year, fell 0.4 percentage points over April; the chain index went up by 0.7 percent, expanded 0.4 percentage points over April. In terms of different categories, the sales price indices of economically affordable housings went up 0.4 percent year-on-year; that of commercial residential buildings dropped 1.5 percent, declined 0.5 percentage points month-on-month, of which, the sales price indices of ordinary and luxury commercial housings went down 0.9 and 3.6 percent respectively. As compared month-on-month, the sales price indices of economically affordable housings remained the general level; that of commercial residential buildings went up 0.7 percent, of the total, ordinary commercial buildings and luxury commercial buildings increased 0.8 and 0.6 percent respectively. In terms of different sub-dwelling sizes, the sales price indices of newly constructed residential buildings at and below 90 square meters fell 0.2 percent year-on-year, while that of chain index increased 0.6 percent. In terms of different regions, as compared year-on-year, 28 cities got an increase of sales price indices of newly constructed residential buildings, of the total, the top fives are: Yinchuan was 5.9 percent, Lanzhou was 5.7 percent, Xining was 4.5 percent, Jinzhou was 4.4 percent, Mudanjiang was 3.1 percent; that of 44 cities dropped, and the top fives are: Shenzhen was 6.9 percent, Shijiazhuang was 6.3 percent, Guangzhou was 5.6 percent, Xuzhou was 5.6 percent, and Guilin was 5.5 percent. As compared month-on-month, 60 cities got an increase of sales price indices of newly constructed residential buildings, of the total, the top fives are: Wenzhou was 3.8 percent, Xiamen was 2.1 percent, Shenzhen was 1.7 percent, Jinhua was 1.5 percent, and Changchun was 1.5 percent. That of 6 cities decreased, the range of decreasing rate was between 0.1-0.5 percent. The sale price indices of second-handed residential housings expanded 0.9 percent year-on-year, or increased 0.9 percentage points month-on-month; the chain index advanced 0.7 percent, narrowed 0.1 percentage points month-on-month. In terms of different regions, as compared year-on-year, 35 cities got an increase of sales price indices of second-handed residential buildings, of the total, the top fives are: Sanya was 10.7 percent, Nanjing was 7.1 percent, Zhengzhou was 6.7 percent, Haerbin was 5.7 percent, and Luoyang was 5.3 percent; while that of 35 cities dropped, and the top fives are: Jilin was 9.8 percent, Shijiazhuang was 6.1 percent, Tangshan was 6.0 percent, Yueyang was 5.6 percent, and Jining was 4.6 percent. As compared month-on-month, 46 cities got picking up, of total, the top fives are: Shenzhen was 4.1 percent, Urumchi was 1.8 percent, Jining was 1.8 percent, Wenzhou was 1.7 percent, and Xiamen was 1.7 percent; that of 9 cities decreased, of which, Yantai was 1.3 percent, the decreasing rate of other cities was in the range between 0.1-0.4 percent. The sales price indices of new non-residential housings dipped 0.2 percent year-on-year, the chain index boomed 0.3 percent. As compared year-on-year, the sales price indices of office buildings were up by 1.5 percent, that of for commercial purposes dropped 0.6 percent, that of for others decreased 4.4 percent. As compared month-on-month, the sales price indices of office buildings were up by 0.6 percent, that of for commercial purposes unchanged, that of for others increased 0.4 percent. V. National real estate development climate index In May, national real estate development climate index was 95.94, promoted 1.18 percentage points month-on-month.
In terms of different indices, the investment index of real estate development was 93.13, came up 1.93 points month-on-month; the index of capital sources was 96.62, up by 2.32 points month-on-month; the index of floor spaces development was 92.55, dipped 0.15 points month-on-month; the index of vacant floor spaces of commercial buildings was 89.05, went down 2.15 points month-on-month; the index of floor spaces of buildings under construction was 93.93, increased 0.46 points month-on-month. |
Related News
Photos
More>>


trade
- Guangzhou Customs Stationed at the Guangzhou Fair for the First Time to Provide
- The Logistic Expressway between Guangzhou and Hong Kong Opened and Cross-Border
- Guangzhou Customs Intercepted and Captured Smuggled Gen-seng over 1 Ton
- Guangzhou Customs Solved 4 Drug-Smuggling Cases One after Another through Postal
- Guangzhou Baiyun Airport Customs House Intercepted and Captured 480 Watches
market
- Guangzhou Customs Built a Customs Clearance Express Way 1000 Motor Vehicles
- Guangzhou Customs New Office Building Opens Today First Floor Services Hall
- Intercept and capture the Air-yacht in the Pearl River estuary valiantly
- Guangzhou Customs Intercepted and Captured Imported Rubbish
- Sub-bureau of Anti-Smuggling of Panyu Customs House intercepted and captured
finance
- Minister SHENG Guangzu Meets with DPR Korean Delegation( with photo)
- Quality Services Provided in NAITE(with photo)
- 3280 Rice Cookers Donated to Quake-hit Areas (with photo)
- Attentive Services Provided to Olympic Materials leaving China (with photo)
- Speedy Clearance Services Provided to Gold Medalists (with photo)