|
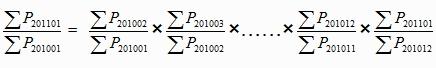
I The Price of Newly Constructed Residential Buildings 1. The sales price of newly constructed residential buildings in 70 large and medium-sized cities were reported that 3 cities of that increased more than 2.0 percent, while 3 cities decreased comparing with the previous month. In view of different regions, the sales price of 26 cities increased among 28 cities in eastern region, which occupied 92.9 percent; that of 2 cities remained the same level, which occupied 7.1 percent. The sales price of 14 cities increased in 16 cities of central region, which occupied 87.5 percent; that of 2 cities remained the same level, which occupied 12.5 percent. The sales prices of 13 cities rose in 18 cities of western region, which occupied 72.2 percent; that of 3 cities declined, which occupied 16.7 percent. The sales price of 7 cities went up In the 8 cities of northeast region,, which occupied 87.5 percent, that of one city remained the same level, which occupied 12.5 percent. 2.Comparing with the same month of last year, the sales price of 68 cities in 70 large and medium-sized cities went up, that of 2 cities went down. Of the total, that of 10 cities grew more than 10 percent. In view of different regions, the sales price of 27 cities among 28 cities in eastern region increased, which occupied 96.4 percent; that of 1 city decreased, which occupied 3.6 percent. The sales price of all 16 cities in central region went up. The sales price of 17 cities among 18 cities in western region climbed, which occupied 94.4 percent; that of 1 city fell, which occupied 5.6 percent. The sales price of all 8 cities in northeast region increased. II Sales Price of Second-Handed Residential Buildings 1. The sales price of second-handed residential buildings in 70 large and medium-sized cities were reported that 5 cities of that increased more than 2.0 percent, while 3 cities decreased comparing with the previous month. In view of different regions, the sales price of second-handed residential buildings in 26 cities in eastern region increased, which occupied 92.9 percent; that of 1 city remained the same level and 1 city decreased, which occupied 7.1 percent; that of all 16 cities in central region increased, and that of 12 cities in western region went up, and 2 cites decreased, which respectively occupied 66.7 and 11.1 percent. In northeast region, the sales price of 6 cities climbed, while 2 cities remained the same level, respectively occupied 75.0 and 25.0 percent. The sales price of 65 cities in 70 large and medium-sized cities went up, that of 5 cities declined. Of which, 6 cities rose above 10.0 percent comparing with the same month last year. In view of different regions, the sales price of second-handed residential buildings in 24 cities in eastern region went up, that of 4 cities decreased, took up 85.7 and 14.3 percent respectively. That of all 16 cities in central region grew up; that of 17 cities in western region shot up, with the proportion of 94.4 percent; that of 1 city decreased, occupied 5.6 percent; and all the cities in northeast region got increase. Note: 1.Since January 2011, NBS started toimplement Survey Program on Sales Price of ResidentialBuilding . The new Program is madea considerable adjustment on data resources, indicators selecting, calculation methods and other factors that may impact on indictors calculation. So that the data in this month may not comparable all with historical data. 2. The calculation of year-on-year index. NBS will compile figures based on transactions records from city-level housing departments. Due to the transaction records started to report since December 2010, the year-on-year data under the same scope can not be calculated. In order to sustain the continuity and stability for the calculation on the y-o-y data, NBS adopts technical methods on the calculation of y-o-y data, based on the concerning statistical data on housing price in 2010 and transaction records in 2011, according to the mathematics relations between y-o-y and chain index. The formula are as followings:
3. Since January 2011, the data of newly constructed residential buildings in 53 cities started to be calculated based on transaction records data. That of the other 17 cities were calculated according to the floor spaces sold and sales values in each items in the real estate development reports. The 53 transaction records collected cities are: Beijing, Tianjin, Shijiazhuang, Taiyuan, Hohhot, Shenyang, Dalian, Changchun, Harbin, Shanghai, Nanjing, Hangzhou, Ningbo, Hefei, Fuzhou, Xiamen, Nanchang, Jinan, Qingdao, Zhengzhou, Wuhan, Changsha, Guangzhou, Shenzhen, Nanning, Haikou, Chongqing, Chengdu, Guiyang, Kunming, Xi an, Lanzhou, Xining, Yinchuan, Urumqi, Qinhuangdao, Baotou, Jilin, Mudanjiang, Wuxi, Yangzhou, Xuzhou, Quanzhou, Jiujiang, Luoyang, Pingdingshan, Huizhou, Zhanjiang, Shaoguan, Guilin, Beihai, Sanya and Nanchong. 4. Eastern Region includes 7 provinces and28 cities, they are: Beijing, Tianjin, Shanghai, Hebei, Jiangsu, Zhejiang, Fujian, Shandong, Guangdong and Hainan. Central Region includes 6 provinces and 16 cities, they are: Shanxi, Anhui, Jiangxi, Henan, Hubei and Hunan. Western Region includes 10 provinces autonomous regions and 18 cities, they are: Chongqing, Inner Mongolia, Guangxi, Sichuan, Guizhou, Yunnan, Shaanxi, Gansu, Qinghai, Ningxia and Xinjiang. Northeast Region includes 3 provinces and8 cities, they are: Liaoning, Jilin and Heilongjiang. 5. The data of 90 and below, 90 -144 and above 144 will be released next month with data on February. Sales Price Indices of Buildings in 70 Large and medium-sized Cities (2011.01) (I)
| ||||||||||||||||||||||||||||||||||||||||||||||||||||||||||||||||||||||||||||||||||||
 stands for price in each month in 2010.
  stands for price in January, 2011.
Related News
- Administrator Xiao Jie Wrote an Article to Stress: Make Great Efforts to Provide Taxpayers with Satisfactory Services
- Xiao Jie Talks with Young Cadres of SAT
- More than 1,100 Pirated Optical Discs Seized at Airport (with photo)
- The Area of International Pavilion of the Canton Fair Doubled and High-Quality Services Provided by Customs Were Praised
Photos
More>>


trade
- Guangzhou Baiyun Airport Customs House Intercepted and Captured 480 Watches
- Guangzhou Customs Built a Customs Clearance Express Way 1000 Motor Vehicles
- Guangzhou Customs New Office Building Opens Today First Floor Services Hall
- Intercept and capture the Air-yacht in the Pearl River estuary valiantly
- Guangzhou Customs Intercepted and Captured Imported Rubbish
market
- Sub-bureau of Anti-Smuggling of Panyu Customs House intercepted and captured
- Minister SHENG Guangzu Meets with DPR Korean Delegation( with photo)
- Quality Services Provided in NAITE(with photo)
- 3280 Rice Cookers Donated to Quake-hit Areas (with photo)
- Attentive Services Provided to Olympic Materials leaving China (with photo)
finance
- Speedy Clearance Services Provided to Gold Medalists (with photo)
- Speedy Customs Clearance Services for Cuba Paralympic Charter Flight (with photo
- Minister SHENG Guangzu Pays Inspection Visit to Customs Command Center for
- Release quickly Imported Newspapers (with photo)
- China Customs: Released 58 Relay Vehicles from Europe quickly(with photo)