|
I. The completion of real estate development From January to June, the total investment in real estate development amounted to 1,450.5 billion yuan, up by 9.9 percent year-on-year, and went up 3.1 percentage points over first five months, while that of a decrease of 23.6 percentage points over same period of previous year. Of which, investment in commercial residential buildings reached 1,018.9 billion yuan, 7.3 percent of increase year-on-year, picking up 3.1 percentage points over first five months, or 29.3 percentage points dropped over same period of previous year, which occupied 70.2 percent of the investment in real estate development. From January to June, the floor spaces under construction of real estate development enterprises in the whole country stood at 2,397 million square meters, a year-on-year increase of 12.7 percent, promoted 1.0 percentage points over first five months; the new started floor spaces of housing stood at 479 million square meters, declined 10.4 percent year-on-year, and 5.8 percentage points narrowed over first five months; the floor spaces completed reached 207 million square meters, climbing up 22.3 percent year-on-year, or 0.3 percentage points decreased over first five months. Of which, the floor spaces completed of residential buildings hit 170 million square meters, went up 22.9 percent, or decreased 0.7 percentage points over first five months. From January to June, the floor spaces purchased of real estate development enterprises in the whole country reached 136.44 million square meters, dropped 26.5 percent year-on-year; the floor spaces developed hit 110.10 million square meters, decreased 15.2 percent year-on-year. II. Sales of commercial buildings From January to June, the floor spaces of commercial buildings sold accounted for 341.09 million square meters, surging up 31.7 percent year-on-year. Of the total, the floor spaces of residential buildings sold increased 33.4 percent; that of office buildings boomed 7.6 percent; that of buildings for commercials uses went up 16.4 percent. From January to June, the total sales of commercial buildings amounted to 1,580.0 billion yuan, up by 53.0 percent year-on-year. Of which, the sales of commercial residential buildings surged 57.1 percent, that of office buildings and buildings for commercial uses increased 19.9 and 30.2 percent respectively. III. The funds sources of real estate development enterprises From January to June, the funds sources of real estate development enterprises reached 2,370.3 billion yuan, a year-on-year increase of 23.6 percent. Of the total, domestic loans amounted to 538.1 billion yuan, up by 32.6 percent; that of utilization of foreign funds reached 24.3 billion yuan, decreased 29.7 percent; that of self-financing funds hit 824.1 billion yuan, went up 10.4 percent; that of other funds accounted for 983.7 billion yuan, rose by 34.7 percent. In view of the other funds, deposits and advantage payments totaled 575.8 billion yuan, ballooned 27.7 percent; and that of personal mortgage loans stood at 282.9 billion yuan, gained in 63.1 percent. IV. Sales price indices of buildings in 70 medium-large sized cities In June, sales price indices of buildings in 70 medium-large sized cities increased 0.2 percent year-on-year, whereas a decrease of 0.6 percent in May; the chain index was booming up by 0.8 percent, increased 0.2 percentage points over May. The sales price indices of newly constructed residential buildings dropped 0.6 percent year-on-year, fell 0.7 percentage points over May; the chain index went up by 0.8 percent, expanded 0.1 percentage points over May. In terms of different categories, the sales price indices of economically affordable housings went up 0.6 percent year-on-year; that of commercial residential buildings dropped 0.8 percent, declined 0.7 percentage points month-on-month, of which, the sales price indices of ordinary and luxury commercial housings went down 0.2 and 0.3 percent respectively. As compared month-on-month, the sales price indices of economically affordable housings surged 0.3 percent; that of commercial residential buildings went up 0.9 percent, of the total, ordinary commercial buildings and luxury commercial buildings increased 0.9 and 0.8 percent respectively. In terms of different sub-dwelling sizes, the sales price indices of newly constructed residential buildings at and below 90 square meters climbed 0.9 percent year-on-year, while that of chain index increased 1.0 percent. In terms of different regions, as compared year-on-year, 34 cities got an increase of sales price indices of newly constructed residential buildings, of the total, the top fives are: Yinchuan was 5.7 percent, Jinzhou was 4.9 percent, Lanzhou was 4.6 percent, Xining was 4.5 percent, and Ningbo was 4.4 percent; that of 36 cities dropped, and the top fives are: Shenzhen was 6.6 percent, Shijiazhuang was 6.5 percent, Xuzhou was 5.4 percent, Xuzhou was 5.0 percent, and Nanjing was 4.4 percent. As compared month-on-month, 63 cities got an increase of sales price indices of newly constructed residential buildings, of the total, the top fives are: Guangzhou was 3.6 pecent, Jilin was 3.1 percent, Wenzhou was 2.9 percent, Baotou was 2.0 percent, and Kunming was 2.0 percent; that of 2 cities decreased, of which, Dali was 1.6 percent, and Shaoguan was 0.1 percent. The sale price indices of second-handed residential housings expanded 2.2 percent year-on-year, or increased 1.3 percentage points month-on-month; the chain index advanced 1.1 percent, expanded 0.4 percentage points month-on-month. In terms of different regions, as compared year-on-year, 39 cities got an increase of sales price indices of second-handed residential buildings, of the total, the top fives are: Sanya was 8.3 percent, Nanning was 7.2 percent, Luoyang was 6.8 percent, Zhengzhou was 6.5 percent, and Harbin was 5.2 percent; while that of 31 cities dropped, and the top fives are: Jilin was 8.9 percent, Shijiazhuang was 7.1 percent, Tangshan was 6.8 percent, Yueyang was 6.4 percent, and Zhanjiang was 4.4 percent. As compared month-on-month, 57 cities got picking up, of total, the top fives are: Shenzhen was 3.9 percent, Wenzhou was 3.3 percent, Yinchuan was 3.0 percent, Nanjing was 2.9 percent, and Ningbo was 1.7 percent; that of 6 cities decreased, of which, Kunming was 2.0 percent, Huizhou was 0.6 percent, Haikou was 0.5 percent, Zunyi was 0.3 percent, Tangshan was 0.2 percent, and Shijiazhuang was 0.1 percent. The sales price indices of new non-residential housings went up 0.2 percent year-on-year, the chain index boomed 0.5 percent. As compared year-on-year, the sales price indices of office buildings were up by 2.4 percent, that of for commercial purposes dropped 0.4 percent, that of for others decreased 5.3 percent. As compared month-on-month, the sales price indices of office buildings were up by 1.2 percent, that of for commercial purposes ballooned 0.2 percent, that of for others decreased 1.2 percent. V. National real estate development climate index
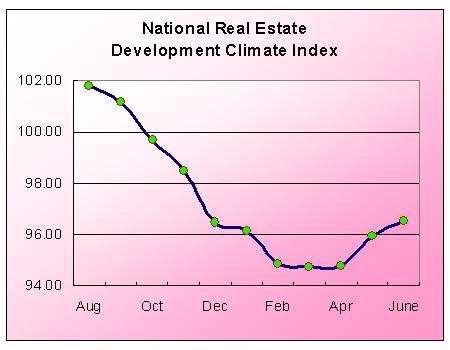
In June, national real estate development climate index was 96.55, promoted 0.61 percentage points month-on-month. In terms of different indices, the investment index of real estate development was 93.60, came up 0.47 points month-on-month; the index of capital sources was 98.73, up by 2.11 points month-on-month; the index of floor spaces development was 92.39, dipped 0.16 points month-on-month; the index of vacant floor spaces of commercial buildings was 88.59, went down 0.46 points month-on-month; the index of floor spaces of buildings under construction was 93.89, decreased 0.04 points month-on-month. |
Related News
Photos
More>>


trade
- More than 1,100 Pirated Optical Discs Seized at Airport (with photo)
- The Area of International Pavilion of the Canton Fair Doubled and High-Quality
- Guangzhou Customs Stationed at China International Small and Medium Enterprises
- Guangzhou Customs Stationed at the Guangzhou Fair for the First Time to Provide
- The Logistic Expressway between Guangzhou and Hong Kong Opened and Cross-Border
market
- Guangzhou Customs Intercepted and Captured Smuggled Gen-seng over 1 Ton
- Guangzhou Customs Solved 4 Drug-Smuggling Cases One after Another through Postal
- Guangzhou Baiyun Airport Customs House Intercepted and Captured 480 Watches
- Guangzhou Customs Built a Customs Clearance Express Way 1000 Motor Vehicles
- Guangzhou Customs New Office Building Opens Today First Floor Services Hall
finance
- Intercept and capture the Air-yacht in the Pearl River estuary valiantly
- Guangzhou Customs Intercepted and Captured Imported Rubbish
- Sub-bureau of Anti-Smuggling of Panyu Customs House intercepted and captured
- Minister SHENG Guangzu Meets with DPR Korean Delegation( with photo)
- Quality Services Provided in NAITE(with photo)